Bridging Genome to Function: Post-Genome Science

Yu Cheng Hsu

Learning Objectives

  • Identify potential ontology databases
  • Analyze functional pathways of:
    • ChIP-Seq
    • DEG
  • Describe basic protein-protein interaction networks

Functional View in Genomics

Connecting Differences to Pathways
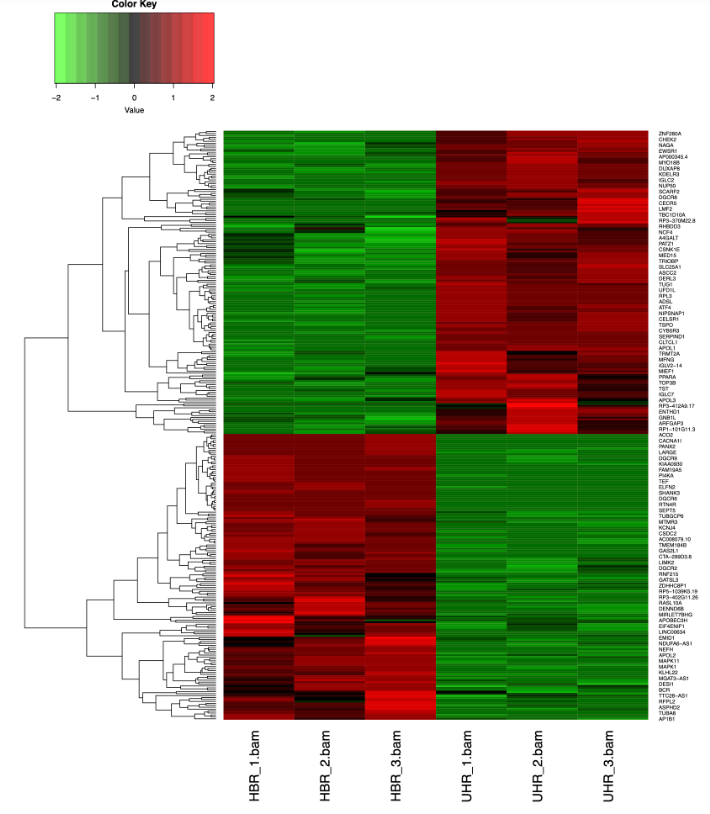
Motivation

  • If 300 genes are differentially expressed, what kind of biological pathways are affected?
  • What are the implications of DNA-microarray/ChIP-seq results in the clinical perspective?

ChIP-seq Data Visualization Differentially Expressed Genes Heatmap Gene Ontology Logo KEGG Pathway Model

  • I cannot lose weight because my genes involved in fat synthesis are upregulated compared to others.

Need for an Encyclopedia

  • We have databases to annotate each gene with its:
    • Location in the genome
    • Molecular function
    • Biological pathways it involves
    • Co-regulated/expressed genes
    • Properties

Databases Recording All Information

Kyoto Encyclopedia of Genes and Genomes (KEGG)

  • Integrates genomic, biological pathway, disease, and drug information
  • Pathway maps depict molecular interaction networks including metabolic, signaling, and genetic information pathways.

Gene Ontology (GO)

  • GO is a standardized, hierarchical ontology for annotating gene products across species
  • Annotates from three perspectives:
    • Biological process
    • Cellular component
    • Molecular functions

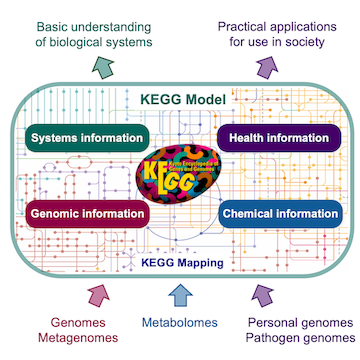
Example of KEGG Pathways

Insulin Secretion Process

Insulin Secretion Process

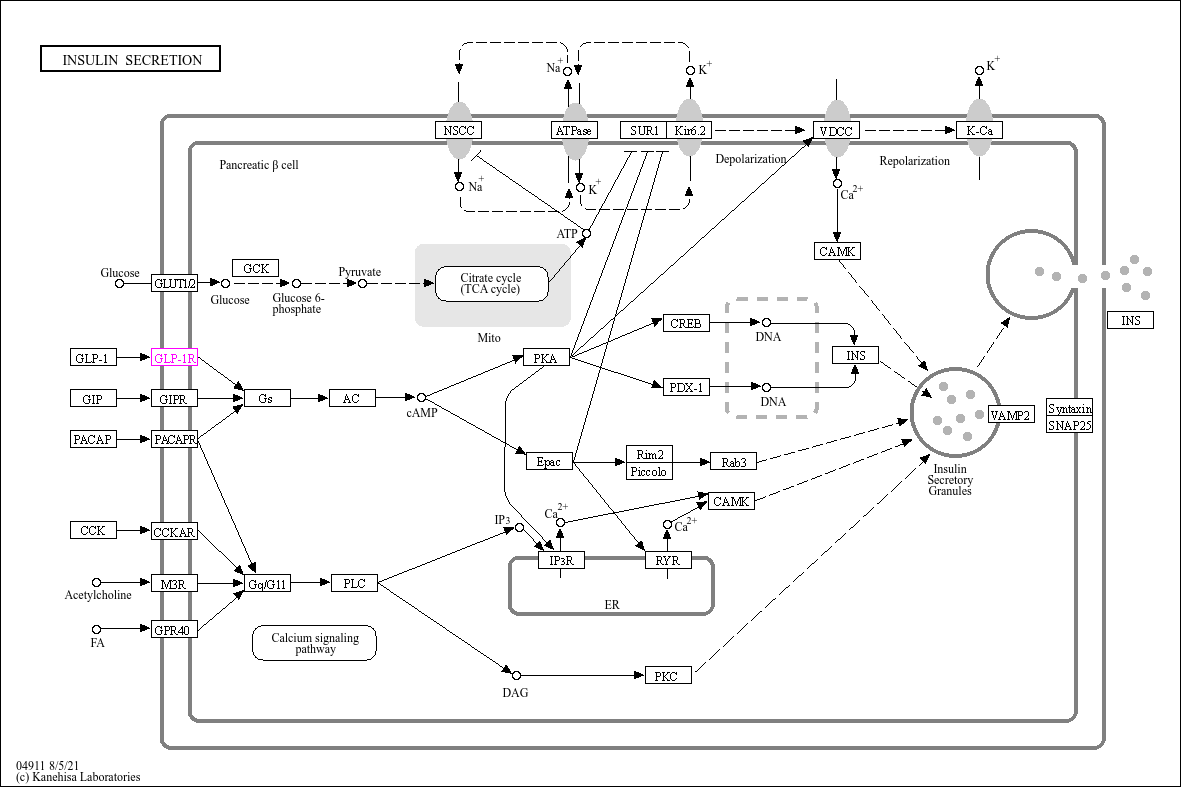
Example of insulin annotation and insulin secretion process in KEGG

Example of GO Pathways

Gene Ontology Annotation for Insulin Secretion

Gene Ontology Annotation for Insulin Secretion

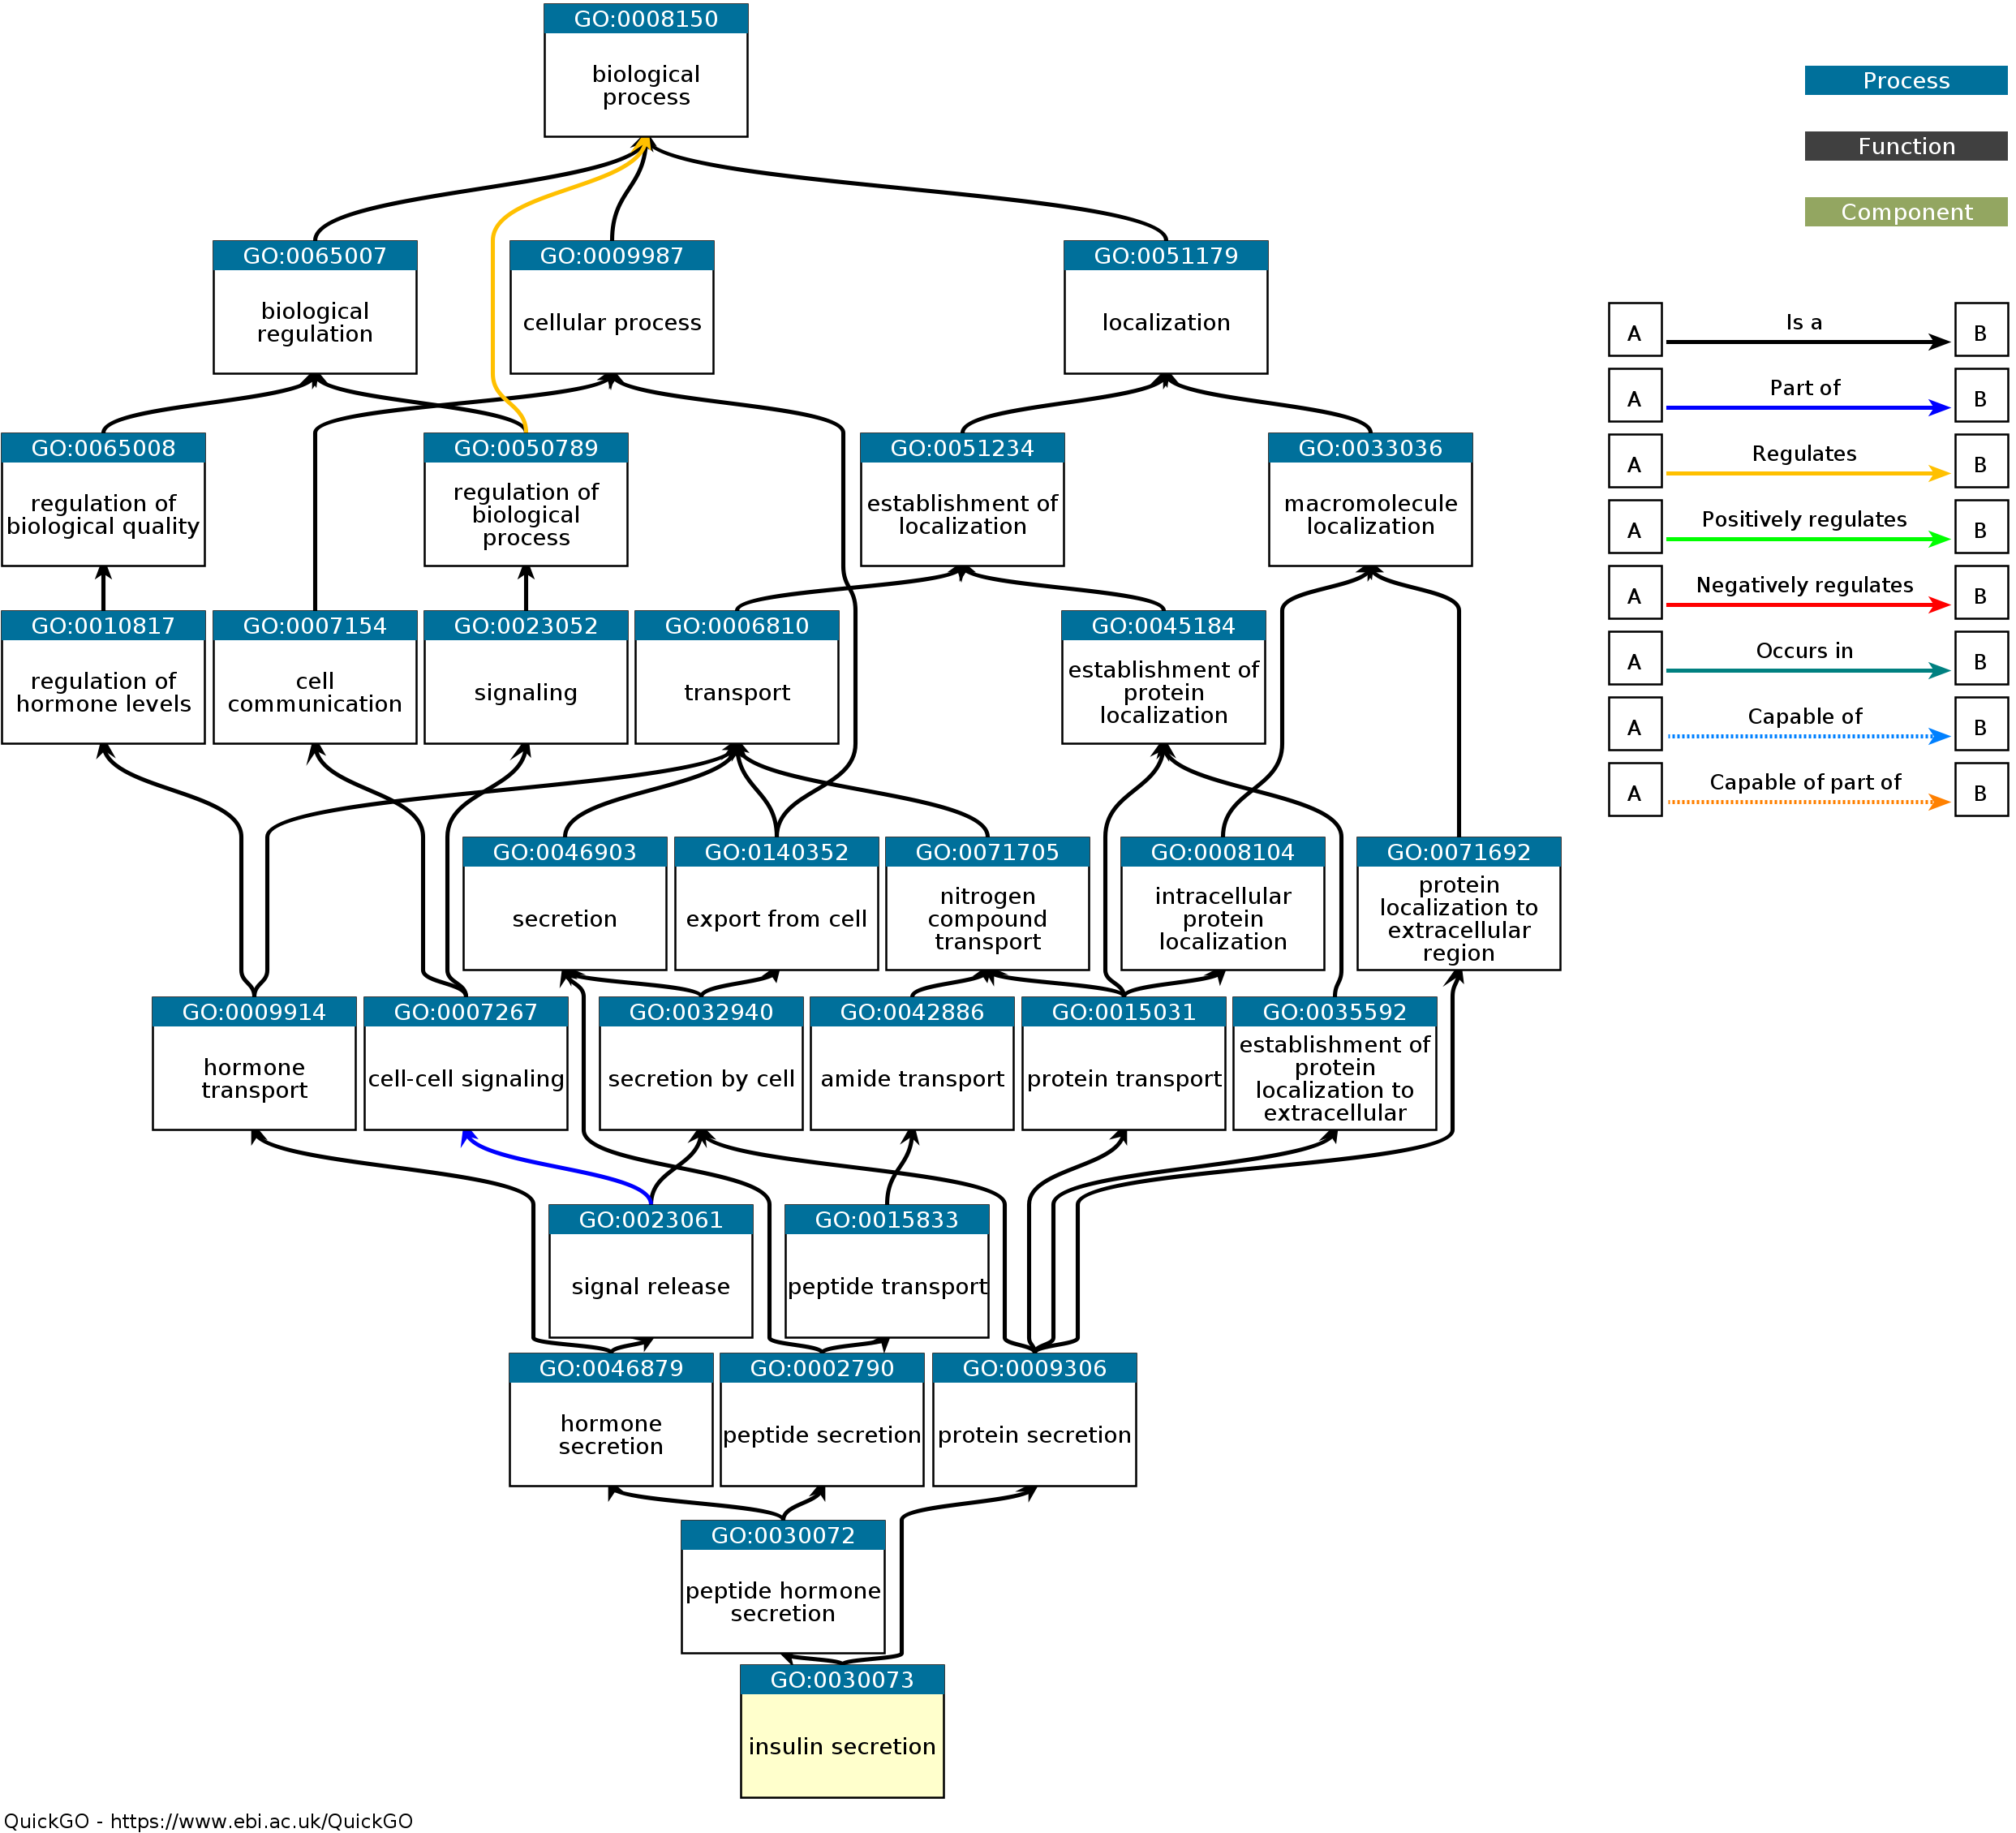
Example of insulin annotation and insulin secretion process in GO

Enrichment Analysis

Connecting Genes to Biological Functions

Enrichment Analysis Summarizes identified differences in genes associated with common functions.

Overview of Enrichment Analysis Khatri, Sirota, and Butte (2012)

Overview of Enrichment Analysis Khatri, Sirota, and Butte (2012)

Enrichment in the Sequence

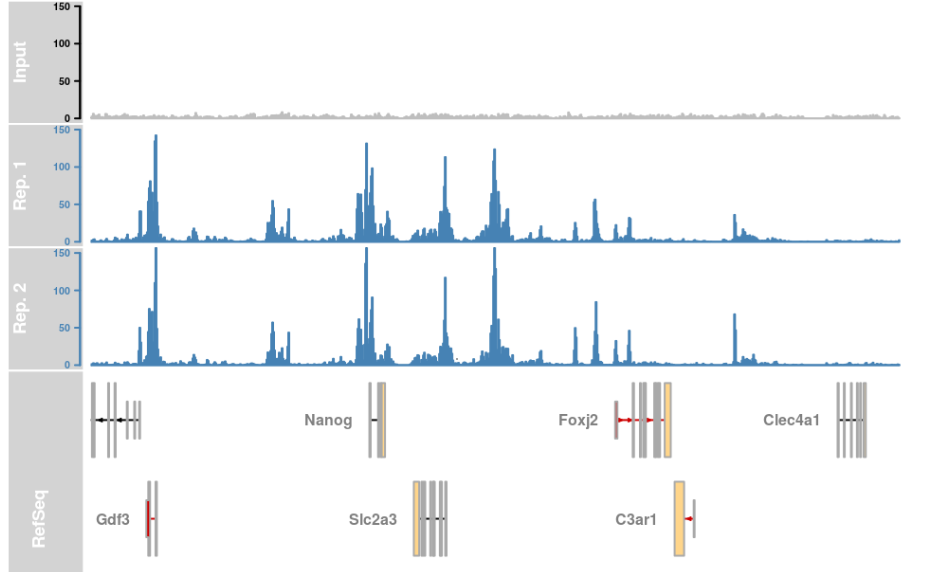
Genomic Regions Enrichment of Annotations Tool

  • Motivation: Do cis-regulatory elements associate with specific pathways?

ChIP-seq Data Visualization

ChIP-seq Data Visualization

Problem Formulation

Motivation Example Welch et al. (2014)

Motivation Example Welch et al. (2014)
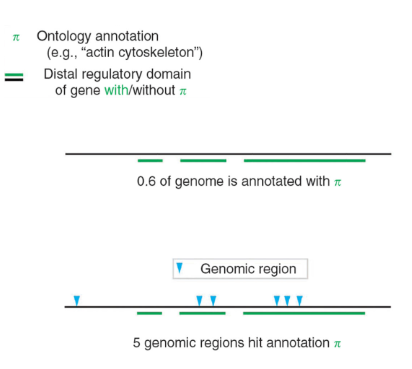
  • Given a 1000 bp sequence
  • From the existing database, 600 bp (located in the figure) is annotated with the functional path \(\pi\)
  • ChIP-seq identified 6 enriched regions bound by protein, among them, 5 are in the annotated region \(\pi\)
  • Question: If the ChIP-Seq identified regions occur randomly, what is the probability that ChIP-Seq identified regions fall into the regulatory domain \(\pi\)?

Binomial Test

Analogy: You are flipping an unfair coin

  1. Chance of having a head: 0.6
  2. Times you flip: 6
  3. Heads you get: 5

ChIP-seq: Identified Region

  1. Chance to be in the regulatory domain: \(p = \frac{\text{Annotated length}}{\text{Total ChIP-seq length}} = \frac{600}{1000}\)
  2. Number of genomic regions identified: \(n = 6\)
  3. Number of genomic regions falling into the annotated area: \(k = 5\)

The probability of getting exactly k heads out of n with the probability \(p\):

\[ P(X = k) = \binom{n}{k}(p)^k(1-p)^{n-k} \]

Back to Our Example

  • We can derive the p-value (probability) to test: How likely is it to get at least \(k\) annotations in the regulatory region out of \(n\) attempts, if the ChIP-Seq peaks occur randomly?

\[ \text{p-value} = P(X \geq k) = \sum_{i=k}^{n}\binom{n}{i}(p)^i(1-p)^{n-i} \]

In our example, it will be

\[ P(X\geq 5) = \binom{6}{5}(0.6)^5(1-0.6)^{1} +\binom{6}{6}(0.6)^6(1-0.6)^{0}=0.23 \]

For a given false discovery rate (FDR, typically 0.05), if \(\text{p-value} < FDR\), we will say that the regulatory element is enriched in the pathway \(\pi\).

Wrap-up: Enrichment Analysis of a Set of Cis-Regulatory Regions

  • For a sequence with length \(N\) with \(K_\pi\) of them annotated with pathway \(\pi\)

  • ChIP-seq selected \(n\) genomic regions and \(k_\pi\) of them fall into the annotation of pathway \(\pi\)

  • \(p_\pi\) is the probability of selecting a base pair annotated with \(\pi\) when selecting a single base pair uniformly from all base pairs in the genome \[ \text{p-value} = P(X \geq k_\pi) = \sum_{i=k_\pi}^{n}\binom{n}{i}(p_\pi)^i(1-p_\pi)^{n-i} \]

  • Each pathway needs to be tested once, and when testing on more than one pathway, P-value correction (e.g., Bonferroni or other methods) should be applied.

Exercise Question

  • On a sequence with length \(100\), with \(14\) of them annotated with the pathway multicellular organismal development
  • ChIP-seq on this sequence showed that 10 enriched regions are bound by protein in older adults compared to young adults; among them, 6 fall into the annotated regions

Q1 What is the p-value of the binomial test that at least 6 out of 10 fall into the annotated regions?

\[ P(X\geq 6) = \sum_{i=6}^{10}\binom{10}{i}(0.14)^i(1-0.14)^{10-i} = 0.00095 \]

Q2 Given the p-value, is the protein enriched in the pathway multicellular organismal development at the 0.05 false discovery rate?

Enrichment in the Protein

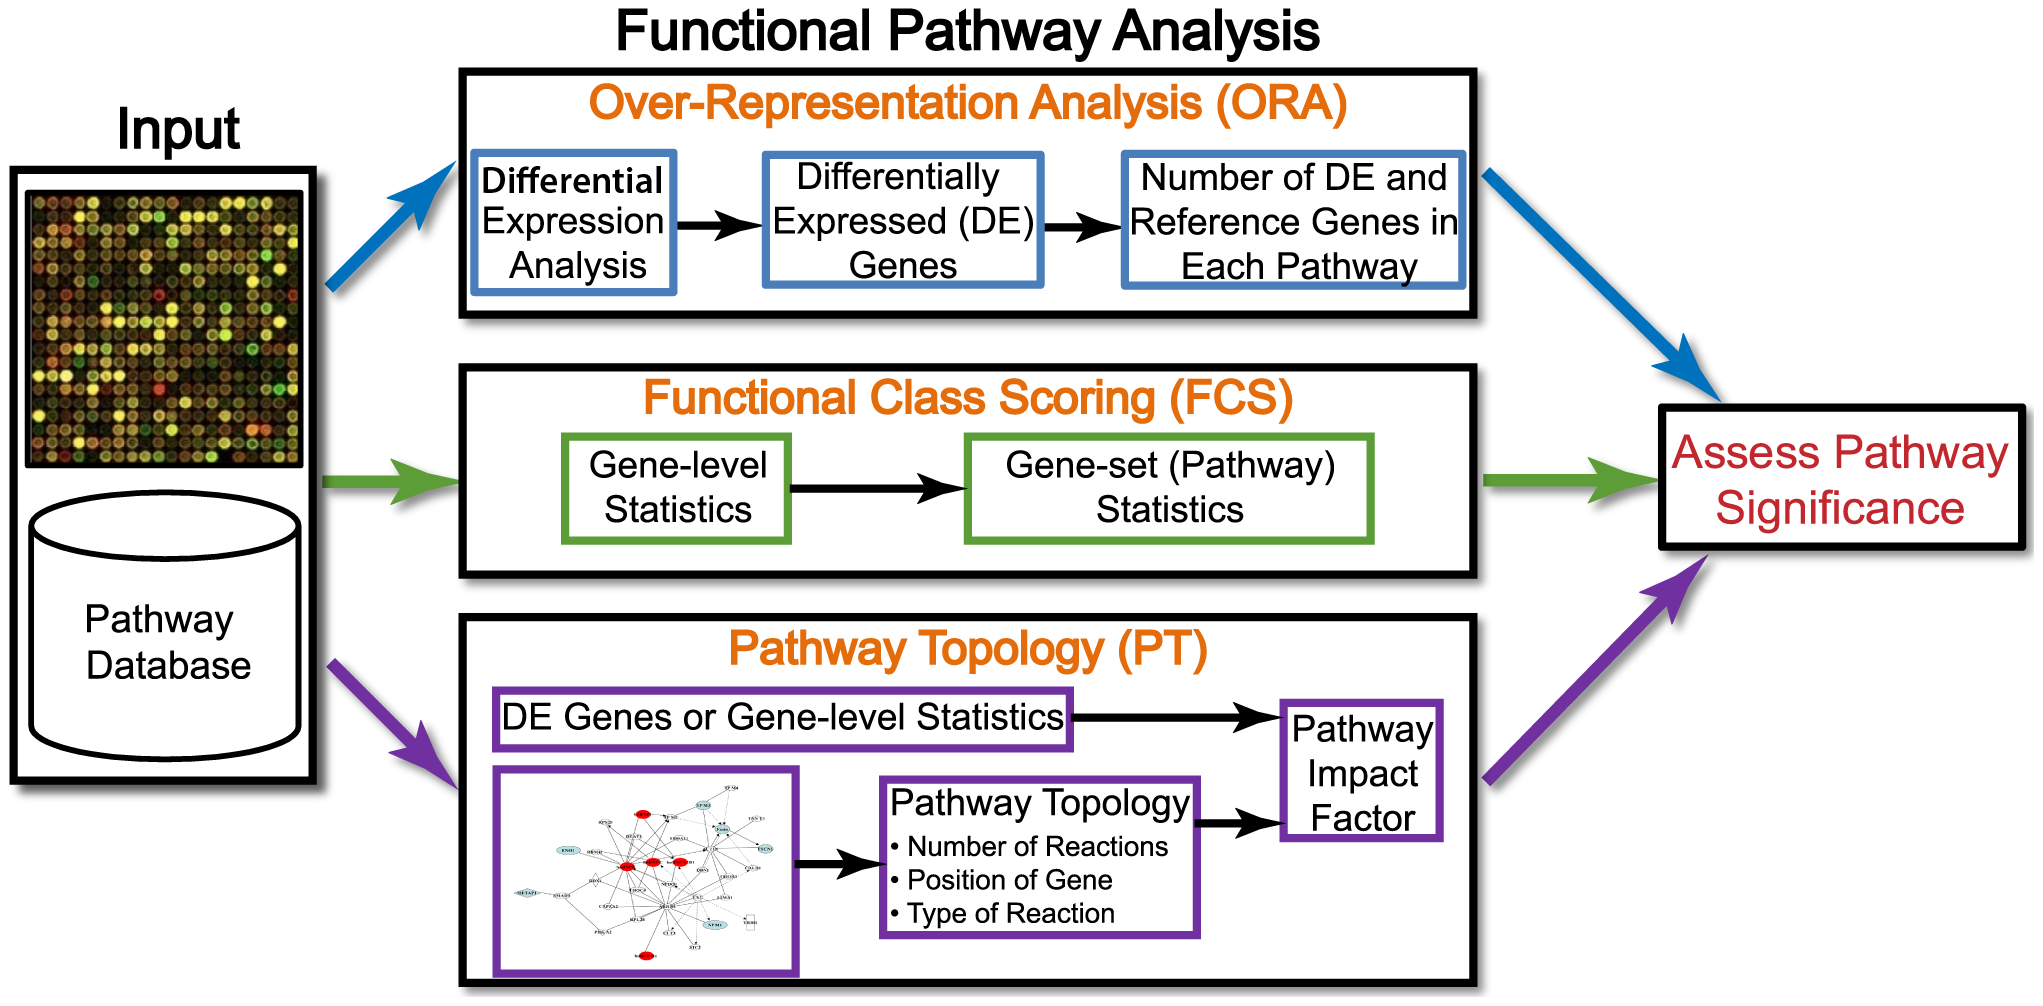
Over-Representation Analysis

  • Motivation: Are biological pathways enriched (over-represented) in an experimentally-derived gene list, e.g., a list of differentially expressed genes (DEGs)?

Pathway Enrichment

Pathway Enrichment
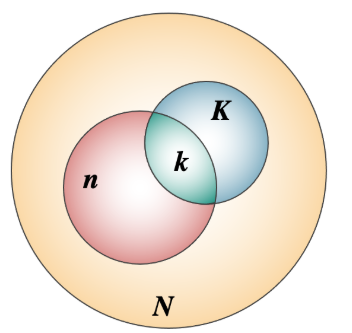
  • \(N\): Background set
  • \(n\): Differentially expressed genes
  • \(K\): Genes in the Pathway \(\pi\)
  • \(k\): Overlapping set

Problem Formulation

Problem Statement

  • 10,000 (\(N\)) genes detected in a microarray study
    • 100 (\(M\), G1-G4,G10001~G10096) of them belong to pathway \(\pi\)
    • 50 (\(n\)) genes were differentially expressed
DE NOT DE Row sum
In \(\pi\) 4(a) 96(b) 100 (\(M\))
NOT in \(\pi\) 46(c) 9854(d) 9900 (\(N-M\))
Column sum 50 (\(n\)) 9950 (\(N-n\)) 10000 (\(N\))
Gene Log2FC Adjusted p-value
G1 -2.8 0.010
G2 2.6 0.028
G3 2.5 0.031
G4 2.4 0.040
\(\vdots\) \(\vdots\) \(\vdots\)
G9999 0.1 0.849
G10000 0.4 0.733
  • Missing pathways we can assume they are not DE

Fisher’s Exact Test

  • If \(a:c \geq b:d\), then the gene set is enriched with pathway \(\pi\)
  • The observation of cells follows a hypergeometric distribution
  • Fisher’s exact test (as one of the cells is less than 5)
  • The p-value is the probability of the table being more uneven than the observation

\[ P = \sum_{i=a}^M \frac{\binom{M}{i}\binom{N-M}{n-i}}{\binom{N}{n}} = 1- \sum_{i=0}^{a-1} \frac{\binom{M}{i}\binom{N-M}{n-i}}{\binom{N}{n}} \]

Back to Our Example

\[ P = \sum_{i=4}^{100}\frac{\binom{100}{i}\binom{9900}{50-i}}{\binom{10000}{50}} = 1- \sum_{i=0}^{3} \frac{\binom{100}{i}\binom{9900}{50-i}}{\binom{10000}{50}} = 0.0015 \]

  • At 5% FDR, the differentially expressed gene is enriched in the pathway \(\pi\)
Differentially Expressed NOT Differentially Expressed Row Sum
In the pathway \(\pi\) 4 96 100
NOT in the pathway \(\pi\) 46 9854 9900
Column Sum 50 9950 10000

Wrap-up: ORA

  • Background gene list with size \(N\),
  • Pathway gene list \(M\)
  • Within the background gene list, \(n\) are differentially expressed and \(a\) of them are in the pathway

\[ P = \sum_{i=a}^M \frac{\binom{M}{i}\binom{N-M}{n-i}}{\binom{N}{n}} = 1- \sum_{i=0}^{a-1} \frac{\binom{M}{i}\binom{N-M}{n-i}}{\binom{N}{n}} \]

  • Each pathway needs to be tested once, and when testing on more than one pathway, P-value correction (e.g., Bonferroni or other methods) should be applied.

Pitfalls of ORA

  • Arbitrary cutoff of the interested gene list
  • Cannot determine the regulation direction:
    • Downregulation
    • Upregulation
  • Even deeper consideration:
    • Gene expressions are not independent events

Exercise Question

Consider a genome with 30 genes, where the functional pathway “PATH_X” contains 5 genes {G1, G2, G3, G4, G5}. 10 are differentially expressed genes in males, with Log2 fold change (Log2FC) and adjusted p-values as follows

Q1 Derive the contingency table for the study above to conduct over-representation analysis. use \(p<0.05\) as selection criteria

Q2 What is the p-value for the over-representation analysis

Gene Log2FC Adjusted p-value
G1 -2.2 0.049
G2 -2.3 0.049
G3 -2.8 0.010
G4 2.3 0.049
\(\vdots\) \(\vdots\) \(\vdots\)
G30 2.4 0.033

Solution

Q1

DE NOT DE
In the pathway 4 1
NOT in the pathway 6 19

Q2

\[\begin{aligned} P & = \sum_{i=4}^5 \frac{\binom{5}{i}\binom{25}{10-i}}{\binom{30}{10}} \\ & = \frac{\binom{5}{4}\binom{25}{10-4}}{\binom{30}{10}}+ \frac{\binom{5}{5}\binom{25}{10-5}}{\binom{30}{10}} =0.03124 \\ & = 1-\sum_{i=0}^3 \frac{\binom{5}{i}\binom{25}{10-i}}{\binom{30}{10}} \\ & = 1 - \biggl( \frac{\binom{5}{0}\binom{25}{10-0}}{\binom{30}{10}}+ \frac{\binom{5}{1}\binom{25}{10-1}}{\binom{30}{10}} \\ &+ \frac{\binom{5}{2}\binom{25}{10-2}}{\binom{30}{10}}+ \frac{\binom{5}{3}\binom{25}{10-3}}{\binom{30}{10}}\biggr) =0.03124 \end{aligned} \]

Functional Class Scoring

  • Motivation: Genes in the same pathway are usually co-expressed together, but they do not necessarily pass the DEGs threshold selection.

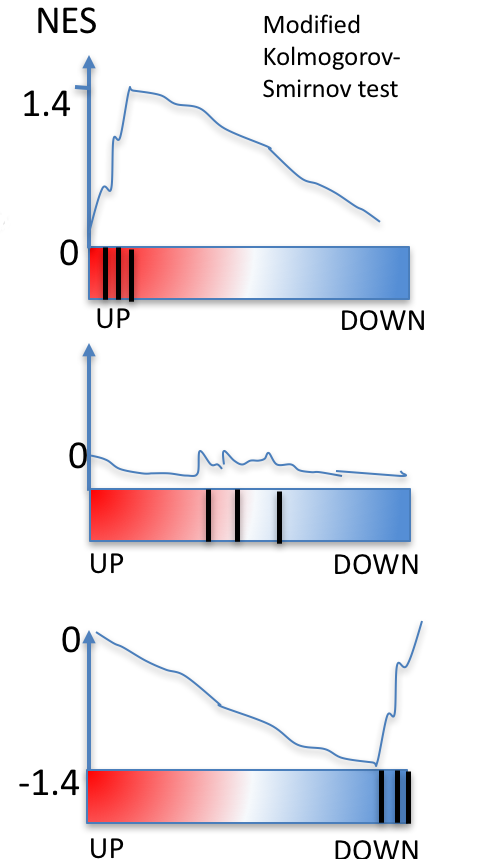
Gene Set Enrichment Analysis (GSEA)

  1. Sort genes (by log fold change)
  2. Calculate running sum from the sorted gene list:
    1. Increase while in the pathway
    2. Decrease while not in the pathway
  3. Find the maximum running sum
  4. Permute the label to calculate p-value

Illustration of GSEA Subramanian et al. (2005); Top:Upregulation, Middle: Not enriched, Bottom: Downregulation

Illustration of GSEA Subramanian et al. (2005); Top:Upregulation, Middle: Not enriched, Bottom: Downregulation

Calculate Running Sum

Consider our gene set with size \(N\), and the pathway \(\pi\) has \(M\) genes in it.

  1. Initial running sum of enrichment score is \(ES_0 = 0\), the denominator \(N_R=\sum |r_j|\), where \(r_j\) is the log fold change of genes that are in the pathway \(\pi\)

  2. Going through the ordered gene \(n_i\) list, do:

    1. If gene \(n_i\) is in the list, \(ES_i = ES_{i-1} + \frac{|r_j|}{N_R}\)
    2. If gene \(n_i\) is NOT in the list, \(ES_i = ES_{i-1} - \frac{1}{N - M}\)

The final enrichment score is \(ES = \max(|ES_i|)\)

If DEG missed some genes in the Path !? :

  • As long as \(N>M\) you can still use the same formula.

Calculating P-values

Permutation Test: Randomly shuffle the gene label for each expression level for \(k\) times and plot the \(ES\) distribution for these \(k\) permutations, and the p-value will be

\[ \small \text{P-value} = \frac{\text{# of times} ES \geq ES_o}{k} \]

Original results
Gene Log2FC
G1 2.3
G2 0.7
G3 2.6
G4 1.4
G5 1.2
G6 0.1
Permutation
Gene Log2FC
G4 2.3
G2 0.7
G6 2.6
G1 1.4
G5 1.2
G3 0.1
Permutation 2
Gene Log2FC
G4 2.3
G1 0.7
G6 2.6
G2 1.4
G3 0.1
G5 0.6

Example

Consider a DEG for 8 genes {G1 to G8}, where the functional pathway “PATH_A” contains 4 genes {G1, G2, G3, G4}. With the readings on the right, please calculate the enrichment score of PATH_A on this array.

Gene Log2FC
G1 2.3
G2 0.7
G3 2.6
G4 1.4
G5 1.2
G6 0.1
G7 0.3
G8 0.6

Example

Rank Gene Hit/Miss Score
1 G3 Hit 2.6/7
2 G1 Hit 2.3/7
3 G4 Hit 1.4/7
4 G5 Miss -1/4
5 G2 Hit 0.7/7
6 G8 Miss -1/4
7 G7 Miss -1/4
8 G6 Miss -1/4
  • Score deducted if the gene is not in the pathway 1/(8-4)
  • Normalized term (\(N_R\)) if the gene is in the pathway: 2.6+2.3+1.4+0.7=7
  • ES
\[\begin{aligned} ES & = \\ & \frac{2.6}{7} + \frac{2.3}{7} + \frac{1.4}{7} \\ & =0.9 \end{aligned}\]

Example 2

Consider a DEG for 8 genes {G1 to G8}, where the functional pathway “PATH_B” contains 5 genes {G1, G2, G3, G4, G5}. With the readings on the right, please calculate the enrichment score of PATH_A on this array.

Gene Log2FC
G1 -2.0
G2 -0.1
G3 -2.3
G4 -1.7
G5 -0.9
G6 0.1
G7 0.3
G8 0.6

Example 2

Rank Gene Hit/Miss Score
1 G8 Hit -1/3
2 G7 Hit -1/3
3 G6 Hit -1/3
4 G2 Miss 0.1/7
5 G5 Hit 0.9/7
6 G4 Miss 1.7/4
7 G1 Miss 2/4
8 G3 Miss 2.3/4
  • Score deducted if the gene is not in the pathway: 1/(8-5)
  • Normalized term (\(N_R\)) if the gene is in the pathway 2+0.1+2.3+1.7+0.9=7
  • ES
\[\begin{aligned} ES & = \\ & |\frac{-1}{3}| + |\frac{-1}{3}| + |\frac{-1}{3}| \\ & = 1 \end{aligned}\]

Comparison of ORA and GSEA

ORA

  • A hard threshold
  • Provides a list of interested genes instead of DEG result

GSEA

  • A soft threshold
  • Needs a DEG result
  • Computationally expensive
  • Can determine the regulation direction

Different results in ORA and GSEA might implies subtle difference at the boundary of arbitrary cut-off (i.e. some genes with p-value like 0.051)

Biological Networks

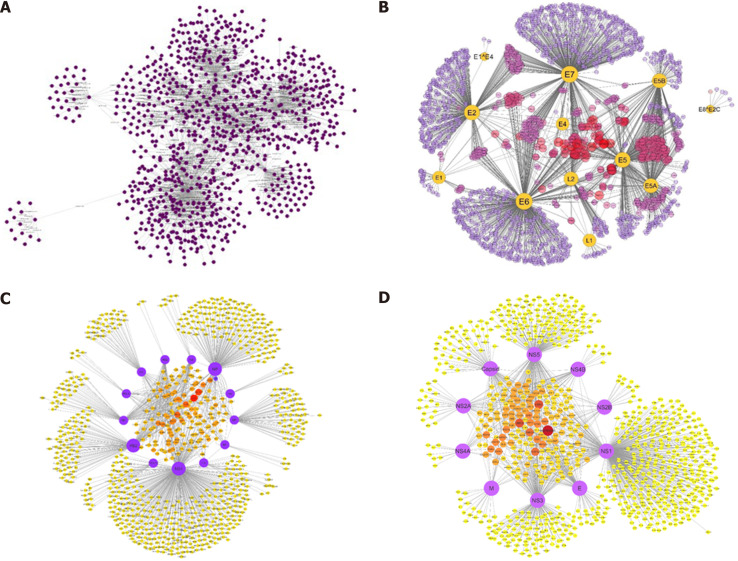
Complexity of Interactions

In reality, proteins can interact together, and it’s more complex than what we’ve seen in KEGG.
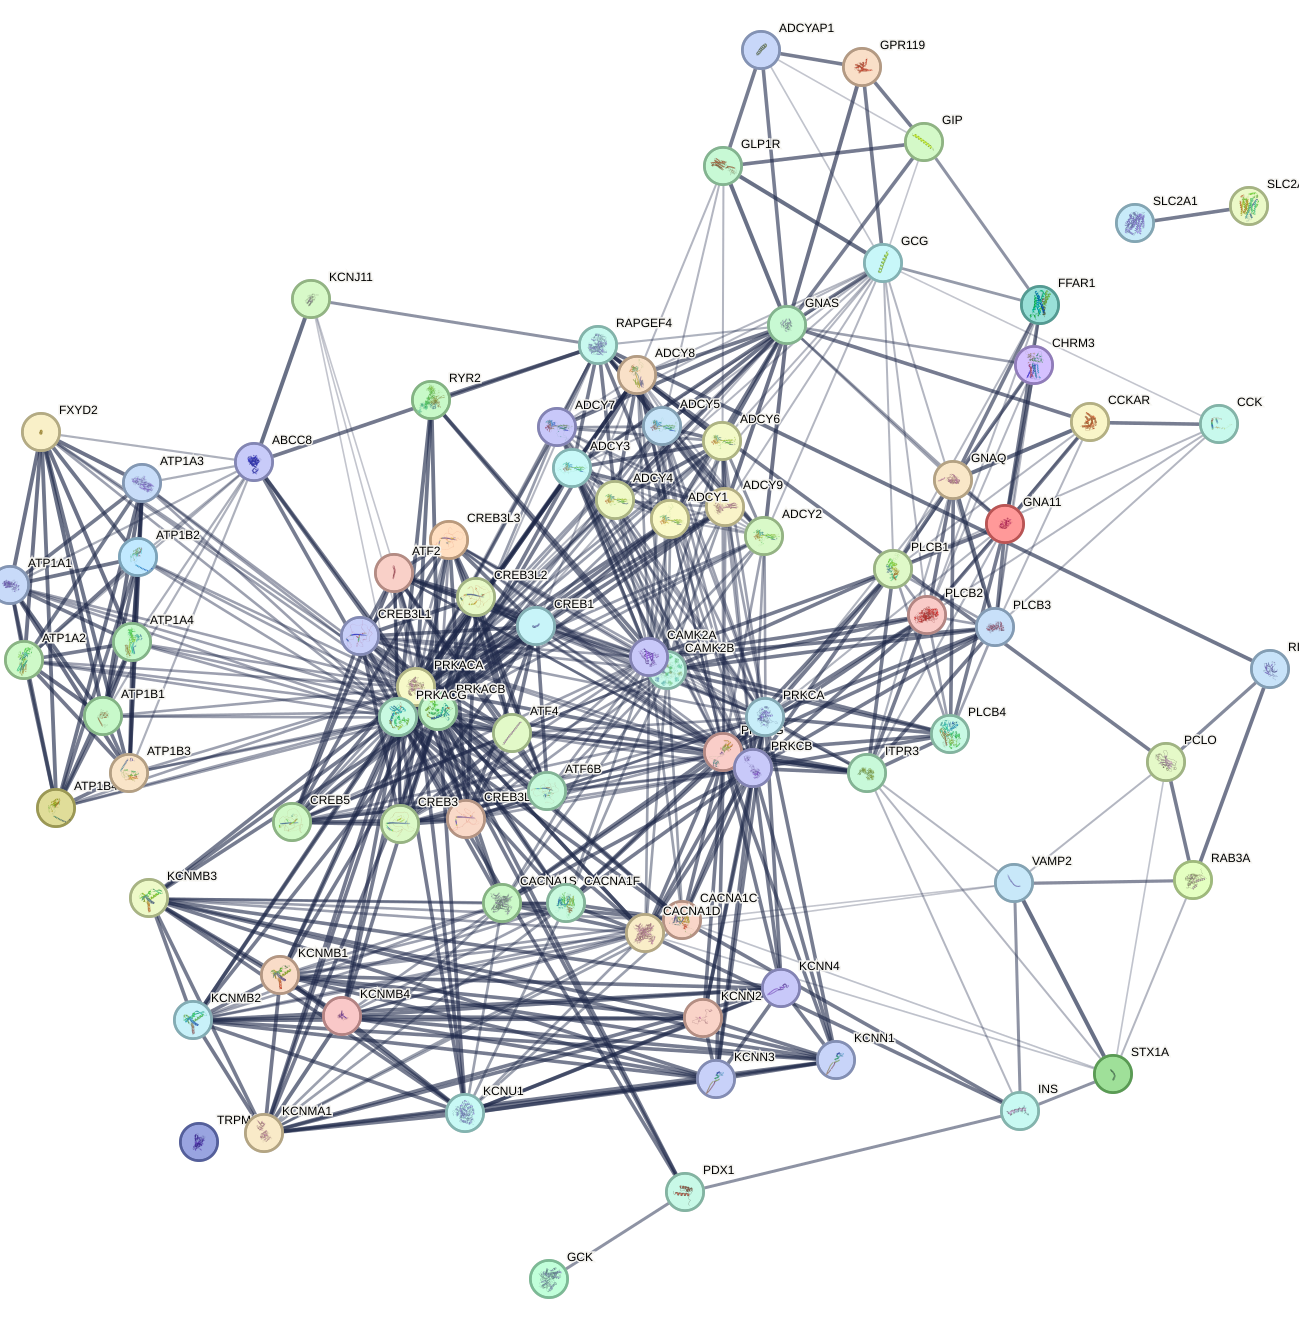
Simplified Insulin Pathway

Simplified Insulin Pathway

Complex Insulin Pathway

Complex Insulin Pathway

Reasons

  • Proteins could interact with each other in other pathways (e.g., some interactions can be related to insulin resistance but not insulin secretion, so KEGG does not show it)

  • Scientific advancements and experiments:

    • Gene co-expression
    • Co-occurrence

Getting Networks

Getting Protein-Protein Interaction (PPI) Network

STRING: A database to document interactions between proteins

  • Interactions:
    • Physical and functional associations
  • Sources:
    • Computational prediction
    • Knowledge transfer between organisms
    • Databases

Definition of the Network

\[\begin{equation*} \begin{split} G&=(V,E) \\ V&=\text{All the nodes (Proteins)}\\ E&=\{(s,e)\} \quad \text{All the edges from s to e (interactions between two)} \end{split} \end{equation*}\]

Importance of a Node
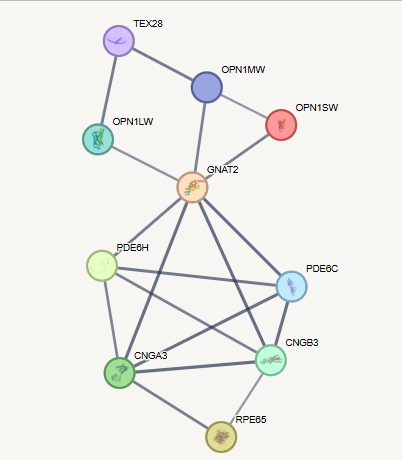
STRING Protein-Protein Interaction Network for Color Blindness

STRING Protein-Protein Interaction Network for Color Blindness

Degree

  • An intuitive measurement of the importance of a node
  • Number of edges connected to the node

\[\begin{equation*} \text{Degree(i)}=\sum_{j=0}^{\vert N\vert}e_{ij} \end{equation*}\]

Degree of:

  • GNAT2: 7
  • TEX28: 2

Local Community of a Network

STRING Protein-Protein Interaction Network for Color Blindness

STRING Protein-Protein Interaction Network for Color Blindness

Clustering Coefficient

  • How many friends of friends are also my friends (Triangles)

\[\begin{equation*} \begin{split} \text{Clustering coefficient(i)}&=\frac{L_i}{\frac{k_i(k_i-1)}{2}}\\ &=\frac{2L_i}{k_i(k_i-1)} \end{split} \end{equation*}\]

  • \(L_i\): Number of triangles including node \(i\)
  • \(k_i\): Number of nodes connected to node \(i\)

Clustering coefficient of:

  • GNAT2: \(\frac{7*2}{7*6}=0.33\), TEX28: \(0\)

Why They Are Important

Degree

  • Importance of a protein
  • Identifying potential drug targets

Clustering Coefficient

  • Identifies potential clusters (sub-functions)
  • Identifying potential drug targets

Application of PPI

  • Exploring disease mechanisms
  • Drug discovery

Application of PPI

Application of PPI

Wrap Up

  • Connecting sequencing results to more informative clinical information:
    • Enrichment in ChIP-Seq and DEG
    • PPI

Bibliography Notes

Khatri, Purvesh, Marina Sirota, and Atul J Butte. 2012. “Ten Years of Pathway Analysis: Current Approaches and Outstanding Challenges.” PLoS Computational Biology 8 (2): e1002375.
Subramanian, Aravind, Pablo Tamayo, Vamsi K Mootha, Sayan Mukherjee, Benjamin L Ebert, Michael A Gillette, Amanda Paulovich, et al. 2005. “Gene Set Enrichment Analysis: A Knowledge-Based Approach for Interpreting Genome-Wide Expression Profiles.” Proceedings of the National Academy of Sciences 102 (43): 15545–50.
Welch, Ryan P, Chee Lee, Paul M Imbriano, Snehal Patil, Terry E Weymouth, R Alex Smith, Laura J Scott, and Maureen A Sartor. 2014. “ChIP-Enrich: Gene Set Enrichment Testing for ChIP-Seq Data.” Nucleic Acids Research 42 (13): e105–5.